Additive zoom level decomposition for e-profile Part I
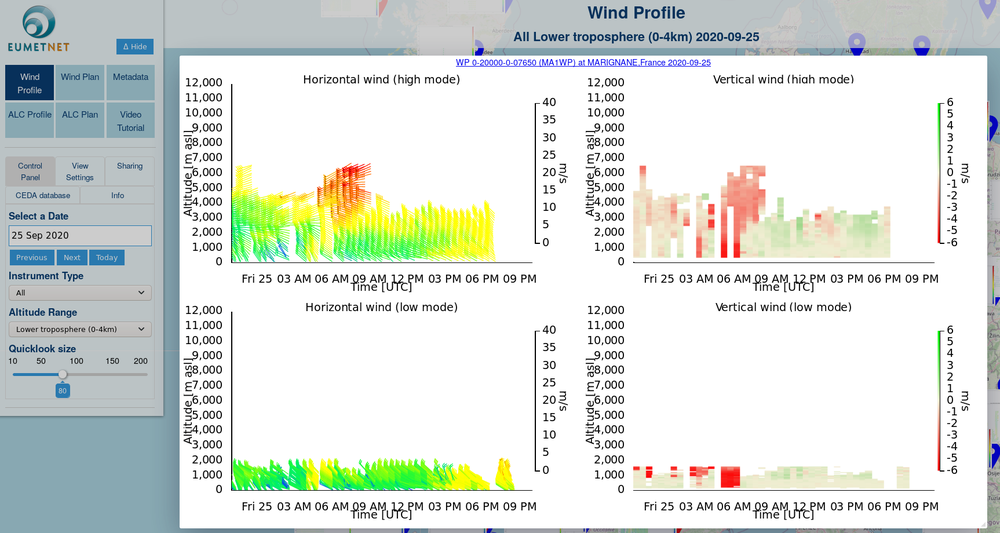
For the https://e-profile.eu project we like to improve the interactive windprofiler windbarb plots.
Additive zoom level decomposition for e-profile Part I
E-Profile is the vulcano ash monitoring system of the European Union. You may remember the erruption of the Eyjafjallajökull vulcano in Island, shutting down the airtraffic over Europe for a while. E-Profile is a concerted initiative of all european weather services to be prepared better for the next erruption.
We play only a minor part in e-Profile, programing and hosting the interactive presentation of all that data (250000 Files per day) at a 5 minute shedule in realtime on E-Profile.eu.
The real work is done at the weather services. They maintain some thousand really picky measurement systems, collecting the raw data, transforming the raw data to physical data, sending this data to the data hub at the Met-Office UK. At the Metoffice UK the data then is calibrated and then send to Inqbus for the visualization.
There are two main categories of instruments in E-Profile(yet):
- Optical: Ceilometers and Lidars: Laser remote sensing devices for aerosol particles.
- Radar: Wind-Profilers and Weather radars and Wind Lidars: Measuring wind speed in three dimensions.
This article deals with the Wind-Profilers (Wind Lidars) and the problems of interactive graphics with them.
We currently utilize a hybride scheme for the interactive display of the windprofiler data:
- For the UV-Winds we utilize SVG graphics to draw windbarbs.
- For the heatmap of the W-Wind we utilize the online gaming lib PixiJS which renders directly to webgl and when not available falls back to canvas rendering.
- Both render schemes were orchestrated by D3 V5 which gives us coordinates, transformations, zoom, pan, etc.
Currently the windbarb information is braindead send at the highest resolution to the browser.
[This is due to the fact that the money runs out while we shifted the whole code from Plone/Bokeh to Flask/VueJS two years ago. We added 30.000 EUR of unpaid work but stil the outcome was not as perfect as we wished. Now there is some new funding and we address the obstacle of the windbarbs again.]
The browser then displays all the information available. This approach is far from perfect:
- The windbarbs overlap for devices with high time and/or altitude resolution.

- This imperfection has its advantage, too. This has gone for a year, now. So we know that we can send the high resolution data to the browser before starting with the rendering and the delay is OK for the user.
The idea for the zoom optimization is :
- Send not more data than before. E.g. send once all data and zooming and panning is then manged in the browser only. Since the users are used to wait a fracture of a second till the data is loaded they will not complain if this stays the same.
- Send an additional zoom level number with each windbarb to associate it with a certain zoom level. This will add to the already transfered datapoint for a windbarb (time, altitude, u_wind, v_wind, speed) the zoom_layer. Since the other parameters are floats the zoom-level which can be a byte is an insignificant addition.
- So we need an additive zoom level decomposition for the datapoints. THis will asure that each datapoint is send only once and is assigned its zoom-level.
- The current interactive image is the additonal superposition of zoomlevels of the data points. It starts with a base set of datapoints and the adds the datapoints with a higher zoom level:
8 8
8 8
Next zoom level
8 4 8
4 4 4
8 4 8
Next zoom level
8 2 4 2 8
2 2 2 2 2
4 2 4 2 4
2 2 2 2 2
8 2 4 2 8
Next zoom level812141218
111111111
212121212
111111111
412141214
111111111
212121212
111111111
812141218
I had the naive idea of simply specify the grid shown above and the lay it over the data and be done.
With numpy and a bit of fancy indexing this was done quite easily. But the outcome was terrible.
